


WI-FI TRAINING
Wi-Fi and non-Wi-Fi Interference
Most transmitters make a unique shape. We can use these signatures to identify what kind of device is transmitting!
Wi-Fi and non-Wi-Fi Interference Examples
Most transmitters in the 2.4 and 5 GHz bands make a unique shape, or "signature". Since they all look a little bit different, we can use these signatures to identify what kind of device is transmitting, which makes tracking things down a lot easier. If you are having trouble identifying a transmitter's signature, look through these examples to try to figure out what it is.
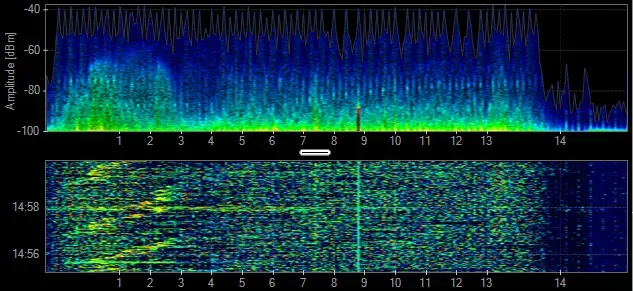
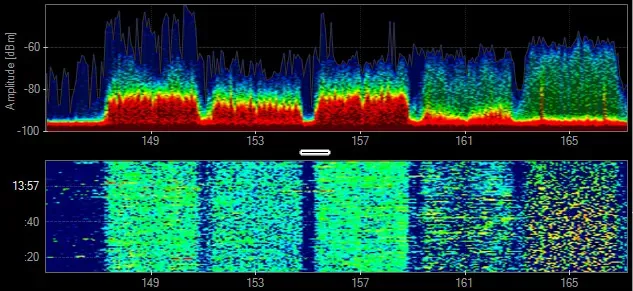
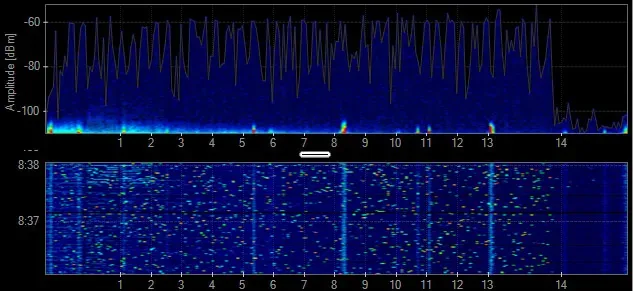
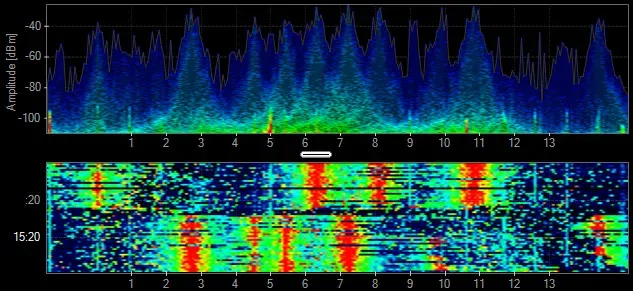
Bluetooth
Bluetooth devices are active in the 2.4 GHz band. These devices are frequency hoppers that impact all channels, so you can't move your Wi-Fi to avoid their transmissions. However, Bluetooth devices are relatively low-powered and hop very quickly, and will have limited impact on Wi-Fi devices. It isn't until many Bluetooth devices are active simultaneously that you are likely to see problems with your Wi-Fi.
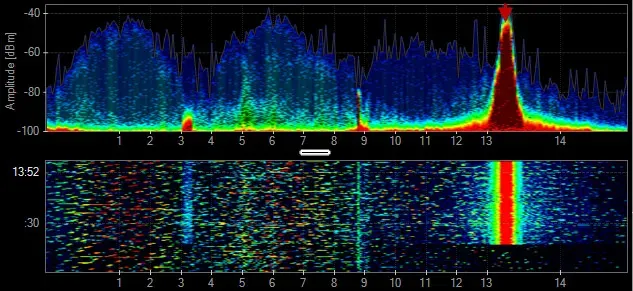
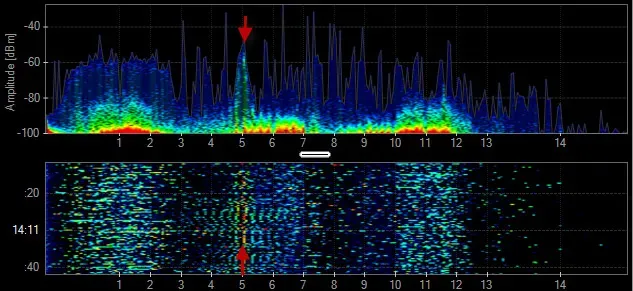
Cordless Phone
Not all cordless phones create the same pattern in the spectrum. Some may create a constant spike in amplitude, while others may frequency hop across the entire spectrum. Cordless phones may change their frequency each time they are used. Channel changes will be noticeable in the amplitude history or waterfall.
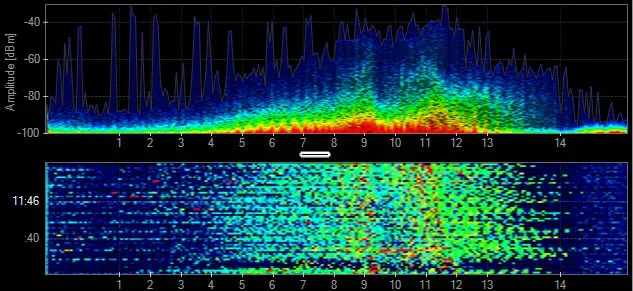
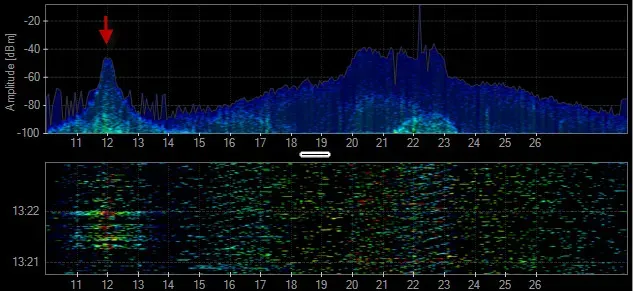
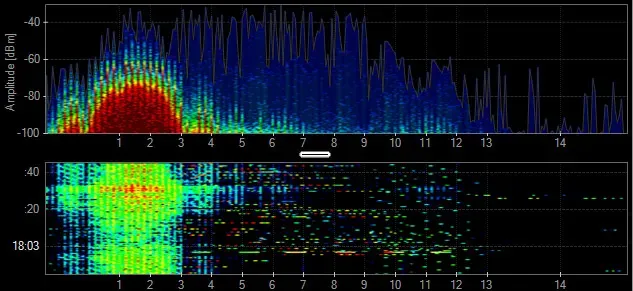
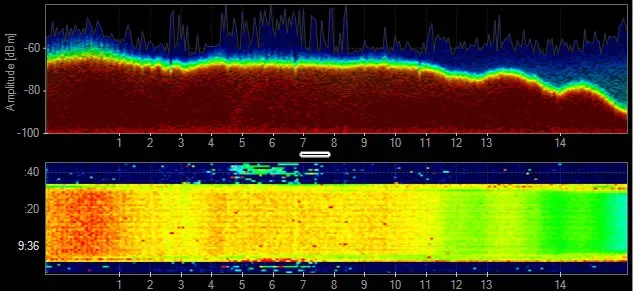
Microwave
Microwave ovens operate in the 2.4 GHz band, and typically create a mountain-like shape in the Density View. Most people use a microwave oven in exact time lengths like 1 minute bursts, which are easily measured in the Waterfall View. The amplitude levels of microwave oven leakage in the 2.4 GHz vary depending on their age, shielding, and distance from the spectrum analyzer.
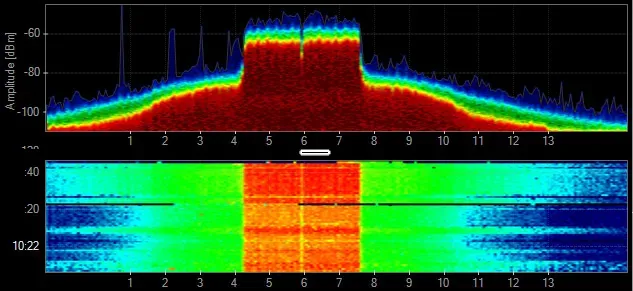
802.11
802.11 has two basic shapes. 802.11b transmissions look like a bell curve, while faster 802.11 data rates are flat across the top.
802.11b - BPSK, QPSK
 PHY: 2.4 GHz
- Data Rates: 1, 2, 5.5, 11 Mbps
802.11g - ERP-OFDM
- PHY: 2.4 GHz
- Data Rates: 6-54 Mbps
- Channel Width: 20 MHz
802.11a - OFDM
- PHY: 5 GHz
- Data Rates: 6-54 Mbps
- Channel Width: 20 MHz
802.11n - OFDM 64-QAM
- PHY: 2.4 & 5 GHz
- Data Rates: 6-450 Mbps
- Channel Width: 20-40 MHz
802.11ac - OFDM 256-QAM
- PHY: 5 GHz
- Data Rates: 6Mbps - 6.9 Gbps
- Channel Width: 20-160 MH
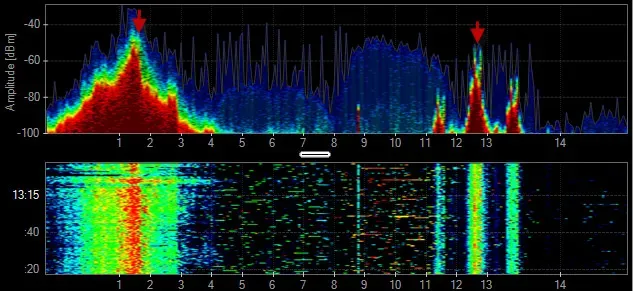
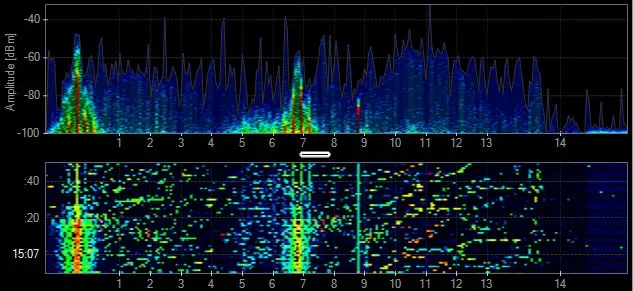
Audio/Video Transmitter
Analog wireless security cameras generally create three spikes in the 2.4 GHz. They constantly transmit and rarely change channels. Look for three adjacent vertical lines in the Waterfall View.
802.15.4
802.15.4 is a Personal Area Network designed for low-rate wireless communication. It is used primarily in automation and control settings with numerous nodes meshed on the same frequency. 802.15.4 is the base technology for ZigBee, WirelessHART and MiWi.
Mouse
A wireless mouse can use standard or proprietary 2.4 GHz wireless technologies. The frequency utilization is very low and the range of contention is minimal.
Audio Headset
Some headsets use proprietary 2.4 GHz technologies to create a Personal Area Network and deliver lossless audio. These audio systems change the frequencies they use to avoid other wireless devices. This can make the issues seem intermittent, and thus difficult to troubleshoot.
Radar Motion Sensor
Motion detectors deployed for lighting control and security systems use a combination of passive infrared sensor (PIR) and 2.4-GHz radar to detect motion. These devices generate significant interference that can disrupt a Wi-Fi network.
Radar
In the past, radars operated in frequency ranges where they were the only type of device in operation. Now there is a need for Wi-Fi access points to operate in accordance with (and avoid using the same frequencies as) a radar device.
Xbox Controller
The Microsoft Xbox controllers utilize their own 2.4 GHz wireless technology. Some of the console's RF is frequency-hopping while the game controllers broadcast on their own frequencies. The duty cycle of these devices is fairly low, but can cause some performance degradation to a wireless network.
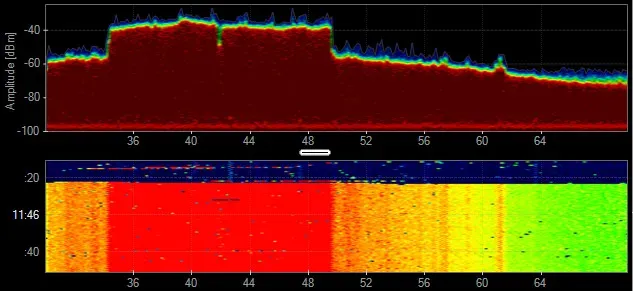
Analog Audio System
Some audio systems use the 2.4 GHz to provide lossless audio quality to speakers throughout a building. The frequency utilization is constantly high and can cause large dead zone areas in indoor and outdoor environments. These analog systems may be mounted in the ceiling and can be difficult to track down.
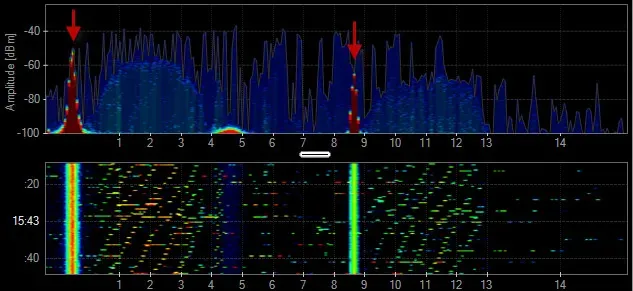
Analog Subwoofer
Similar to wireless audio systems, the subwoofers typically create 1 to 3 narrowband spikes of constant activity in the 2.4 GHz band.
Analog Microphone or Guitar
Similar to other audio devices, microphones and guitars can create constant interference. When deploying a wireless network that coexists with live music, test all of the equipment to make sure the instruments do not cause interference to the WLAN.
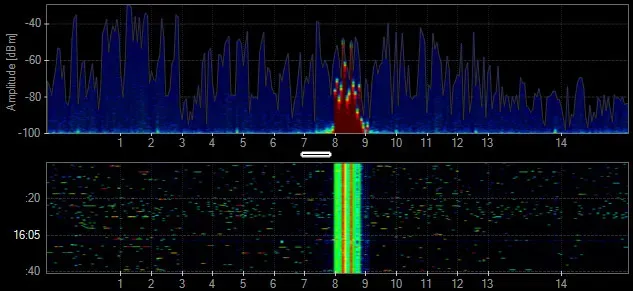
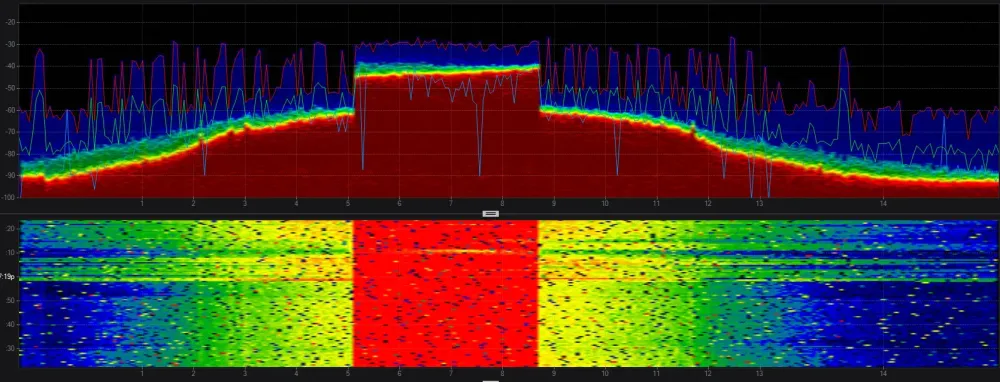
Generic TDD
A time division duplex (TDD) transmitter shares a channel or a frequency range to communicate with other devices using the same channel. This technology can look similar to Wi-Fi in the spectrum.
Jammer
A jamming transmitter creates constant noise across each frequency. These are used in a denial-of-service attack, and will prevent other wireless technologies from fully operating.
Generic Waveform
Continuous transmissions with a narrow band. Devices include PIR, Microphones, Proximity Sensors, and Wireless Audio, among others.
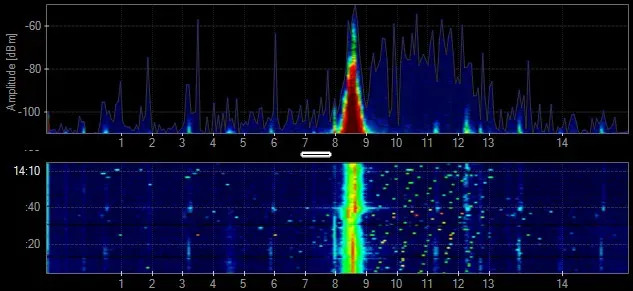
Video Baby Monitor
Some baby monitors can take a wide range of the 2.4 GHz band while other use a smaller frequency range with higher utilization. Video Baby Monitors can be problematic for residential Wi-Fi.
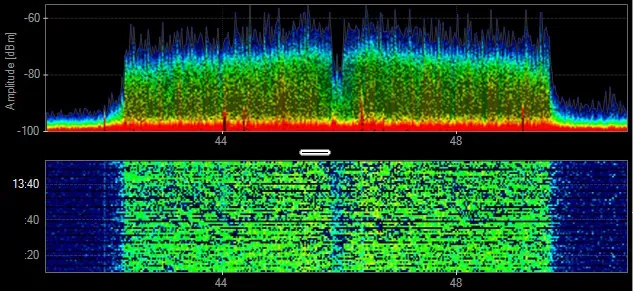
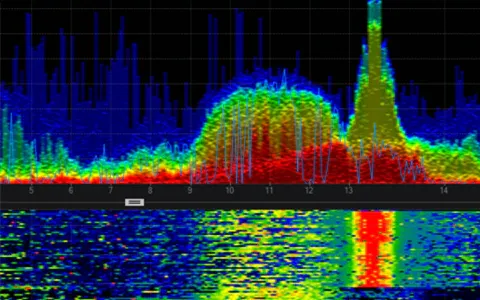
DJI Mavic 2 Pro (drone and controller)
This drone and its controller communicating takes up the entire 2.4 GHz spectrum and looks eerily like an 802.11 signature but without the center null carrier
Enter your email to subscribe to our newsletter and receive updates.
At Oscium, we've spent over 16 years turning complex technology into tools that
work better for everyone.
©2026 OSCIUM. All Rights Reserved.