


-30 dBmAmazing
Max achievable signal strength. The client can only be a few feet from the AP to achieve this. Not typical or desirable in the real world.
Required for:N/A
WI-FI TRAINING
RSSI stands for Received Signal Strength Indicator, and measures how well a client device can hear (receive) a signal. Learn how to understand the index and how it’s used in measuring the strength of your Wi-Fi signal.
RSSI measures Wi-Fi signal strength at the receiving device. It's reported as a negative dBm value, where numbers closer to zero are stronger. -70 dBm is the minimum for reliable email and web, -67 dBm is needed for VoIP and streaming video, and anything below -80 dBm becomes unreliable.
RSSI, or Received Signal Strength Indicator, is a measurement of how well your device can hear a signal from an access point or router. It is a value that is useful for determining if you have enough signal to get a good wireless connection.
Because the value is pulled from the client device's Wi-Fi card (hence "received" signal strength), it is not the same as transmit power from a router or AP.
dBm and RSSI are different units that both represent signal strength. The difference is that RSSI is a relative index, while dBm is an absolute number representing power levels in milliwatts.
RSSI measures the relative quality of a received signal but has no absolute value. The IEEE 802.11 standard specifies that RSSI can be on a scale of 0 to 255, and each chipset manufacturer can define their own "RSSI_Max" value. Cisco uses 0–100, Atheros uses 0–60, and so on. The higher the RSSI value, the better the signal.
Because RSSI varies between chipsets, MetaGeek software uses dBm, a standardized measurement on a logarithmic scale. The closer to 0 dBm, the better the signal.
| SIGNAL STRENGTH | TL;DR | DESCRIPTION | REQUIRED FOR |
|---|---|---|---|
| -30 dBm | Amazing | Max achievable signal strength. The client can only be a few feet from the AP to achieve this. Not typical or desirable in the real world. | N/A |
| -67 dBm | Very Good | Minimum signal strength for applications that require very reliable, timely delivery of data packets. | VoIP/VoWi-Fi, streaming video |
| -70 dBm | Okay | Minimum signal strength for reliable packet delivery. | Email, web |
| -80 dBm | Not Good | Minimum signal strength for basic connectivity. Packet delivery may be unreliable. | N/A |
| -90 dBm | Unusable | Approaching or drowning in the noise floor. Any functionality is highly unlikely. | N/A |
Max achievable signal strength. The client can only be a few feet from the AP to achieve this. Not typical or desirable in the real world.
Minimum signal strength for applications that require very reliable, timely delivery of data packets.
Minimum signal strength for reliable packet delivery.
Minimum signal strength for basic connectivity. Packet delivery may be unreliable.
Approaching or drowning in the noise floor. Any functionality is highly unlikely.
These numbers are suggestions only. Desired signal strength varies based on network requirements. Source: Oscium / MetaGeek published guidance.
Most operating systems show signal strength as bars on a toolbar icon, which is not granular enough for troubleshooting. To see the actual dBm value, you need a Wi-Fi scanning tool.
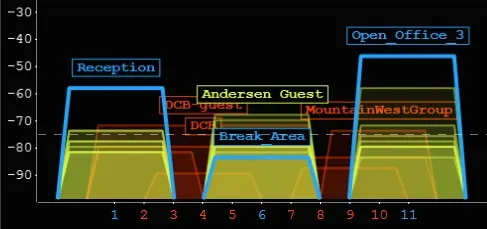
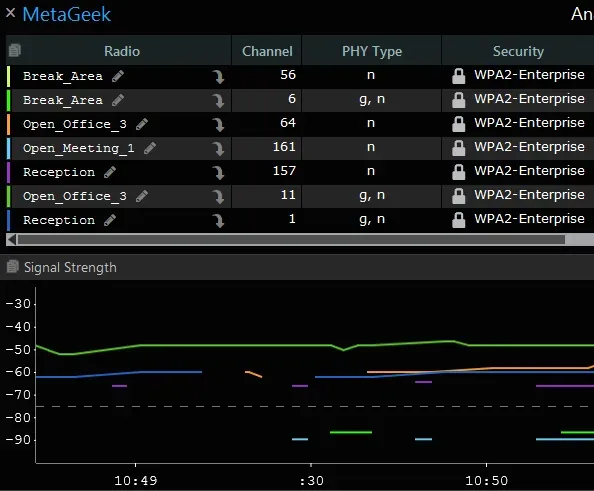
Oscium's inSSIDer (free) displays signal strength in two ways: a Networks Table that shows where each network sits on the 2.4 or 5 GHz band, and a Signal Strength Over Time graph that shows how your network's signal changes as you move around.
If your signal strength looks fine but you're still seeing slowdowns or disconnects, interference is the likely culprit. Your Wi-Fi card can show you some types of interference, but for non-Wi-Fi interferers (microwaves, Bluetooth, baby monitors), you need a spectrum analysis tool.
This is where a dedicated spectrum analyzer like Wi-Spy Lucid pays off. It catches what your Wi-Fi card can't see, the actual RF energy in the air across the 2.4, 5, and 6 GHz bands.
READY TO MEASURE YOUR WI-FI?
Start with inSSIDer to see your signal. Add Wi-Spy Lucid when you need to spot interference your Wi-Fi card can't see.
Free
Free Wi-Fi scanner that shows you exactly what your network looks like, including the live RSSI of every network in range.
$999
Tri-band spectrum analyzer that catches non-Wi-Fi interference your Wi-Fi card can't see. The pro toolkit for when signal alone isn't the answer.
Enter your email to subscribe to our newsletter and receive updates.
At Oscium, we've spent over 16 years turning complex technology into tools that
work better for everyone.
©2026 OSCIUM. All Rights Reserved.